¶ 1993 AMC8 Problem 5
Problem:
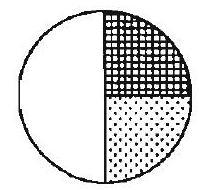
Which one of the following bar graphs could represent the data from the circle graph?
Answer Choices:
A.
.jpg)
B.
.jpg)
C.
.jpg)
D.
.jpg)
E.
.jpg)
Solution:
The unshaded area is half the total, and each of the shaded areas is one fourth of the total. This is represented in bar graph .
Answer: .
The problems and solutions on this page are the property of the MAA's American Mathematics Competitions