¶ 1994 AMC8 Problem 18
Problem:
Mike leaves home and drives slowly east through city traffic. When he reaches the highway he drives east more rapidly until he reaches the shopping mall where he stops. He shops at the mall for an hour. Mike returns home by the same route as he came, driving west rapidly along the highway and then slowly through city traffic. Each graph shows the distance from home on the vertical axis versus the time elapsed since leaving home on the horizontal axis. Which graph is the best representation of Mike's trip?
Answer Choices:
A. .jpg)
B. .jpg)
C. .jpg)
D. .jpg)
E. 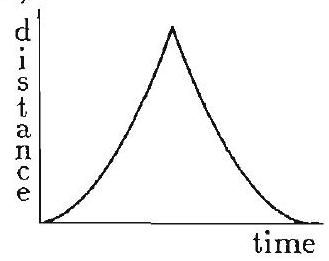
Solution:
Both graphs and show a flat segment indicating no change in distance, or a stop. Graph shows a constant change in distance indicating a constant rate of driving before and after the stop. Graph shows a slow change in distance (shallow graph) followed by a more rapid change in distance (steep graph) indicating a slower rate followed by a faster rate of driving before the stop. After the stop, it shows a faster rate of driving followed by a slower rate. Thus, graph corresponds to Mike's trip.
Answer: .
The problems and solutions on this page are the property of the MAA's American Mathematics Competitions