Problem:
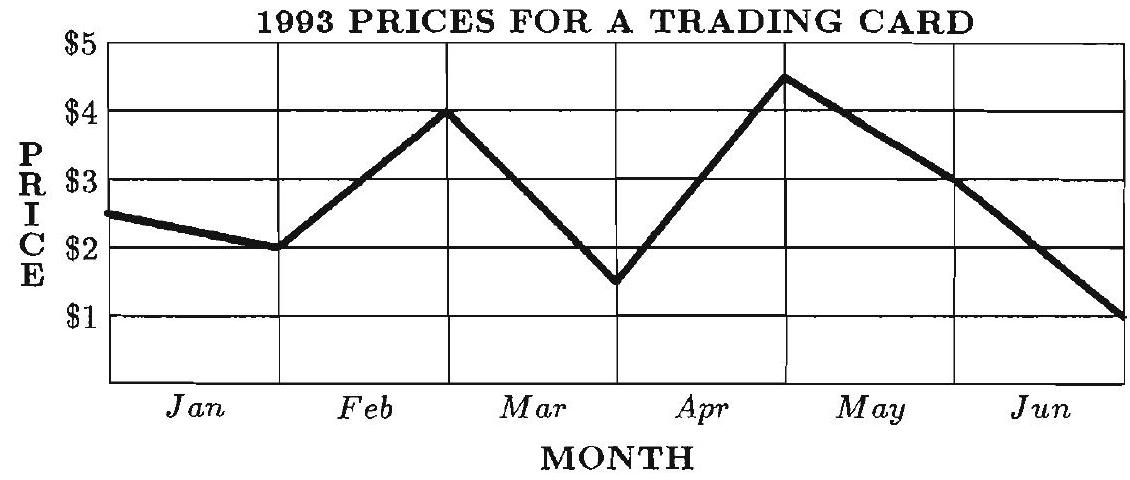
This line graph represents the price of a trading card during the first 6 months of 1993.The greatest monthly drop in price occurred during
Answer Choices:
A. January
B. March
C. April
D. May
E. June
Solution:
The graph shows the following changes in the price of the card:
Jan:Feb:Mar:Apr:May:Jun:Price Change$2.50 to $2.00$2.00 to $4.00$4.00 to $1.50$1.50 to $4.50$4.50 to $3.00$3.00 to $1.00Descriptiondrop of $0.50rise of $2.00drop of $2.50rise of $3.00drop of $1.50drop of $2.00
The greatest drop occurred during March.
Answer: B.
The problems on this page are the property of the MAA's American Mathematics Competitions