Problem:
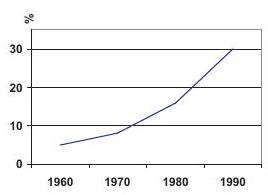
In only of the working adults in Carlin City worked at home. By the "at-home" work force had increased to . In there were approximately working at home, and in there were . The graph that best illustrates this is:
Answer Choices:
A.
.jpg)
B.
.jpg)
C.
.jpg)
D.
.jpg)
E.
Solution:
The data are , and . Only graph has these entries.
Answer: .
The problems on this page are the property of the MAA's American Mathematics Competitions